Our Bright Futures Model is a comprehensive academic support system that combines high-impact private tutoring, student development opportunities, and family support to help children build the knowledge, skills, and confidence to pursue a brighter future.
Meet the Students
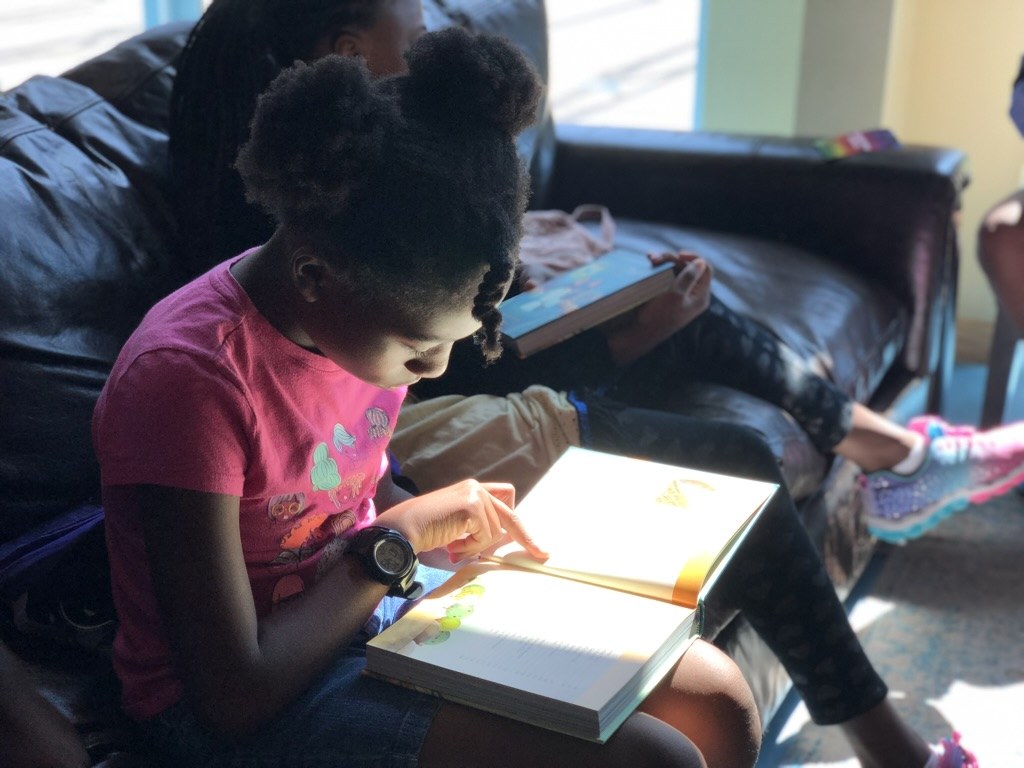
These interconnected components work together to provide consistent academic support, meaningful opportunities, and family resources, all built on a foundation of high-impact private tutoring.
We walk alongside students and families year after year, providing consistent support as their needs evolve and their possibilities grow.
IXL and Stevenson Literacy are how we track every student's growth day to day — and independent, national testing backs up what we're seeing.
Average gain in math standing (median +13); 8 of 11 students climbed relative to grade-level peers.
Measured through Stevenson Literacy; 9 of 10 students advanced, none moved backward.
NWEA's independent national norms are built so a typical student grows at about the 50th percentile in a year. 6 of our 9 tested students grew faster than that — outpacing the typical student in their grade, nationwide.
Catching up — not yet caught up. Many of our students arrive 2–3 grade levels behind. The numbers above measure speed — how much ground a student covers in a year — and most are outpacing the national average. But speed isn't the same as arrival: closing a multi-year gap takes several years at that pace, so only 2 of 9 have reached the national grade-level median so far. Fast progress from behind is still progress from behind — and that's exactly the work.
How we measure progress. IXL is our primary progress measure — active students are assessed in it up to three times a year, so we track growth continuously and most have several data points, not a single before-and-after. (Early readers are followed through Stevenson Literacy.) The headline figures above are slices of that ongoing tracking: a student works one subject at a time, and NWEA MAP is a separate national test only some districts give. That's why the groups differ in size — each number reflects one subject on one measure, not everyone whose progress we follow.
Behind every number is a student gaining the skills and confidence to keep moving forward.
Reporting period: 2025–26 school year. Growth-vs-peers is from the independent NWEA MAP assessment; math gains from IXL, reading from Stevenson Literacy. Sample size (n) is shown on each metric.Your sponsorship helps make Noggin's comprehensive academic support system possible. You'll be connected with a student and receive quarterly progress updates, giving you an opportunity to see the difference your generosity is making over time.